This is real-time prototype of a two-dimensional representation of quote data.
The y-axis shows cumulative number of shares. The x-axis shows average price per share.
To find the average price per share for a given transaction size;
find the desired number of shares on the y-axis
extend a horizontal line across the graph
drop a line down from the left intersection point to find the average price per share you'd pay if you entered a buy order, or
drop a line down from the right intersection point to find the average price per share you'd get if you entered a sell order
This is superior to a standard bid/ask quote because it tells you the price to expect for *your* order instead of the random number of shares that happens to exist at the inside any given moment.
The shape of the curves also tells you about the depth of the market in the stock. Steep canyons indicate lots of liquidity and that large orders will have low impact. Gently sloping plains are a sign of low liquidity.
This prototype is based solely on book data from the Island ECN just because it is free and I have direct access to it. It could just as easily be based on a full consolidated quote from all market participants.
Keep in mind that this is only a prototype. A production version would much prettier, useable, and accurate.
For the best demonstration, use a popular stock like INTC, DELL, or CSCO and look between the hours of 9:00am and 5:00pm.
What Depth Quote would you like to see?
If it doesn't work, try again in 5 minutes.
UPDATE: Unfortunately it looks like NASDAQ has taken down the server that used
to provide these charts (or maybe it died on its own and no one noticed).
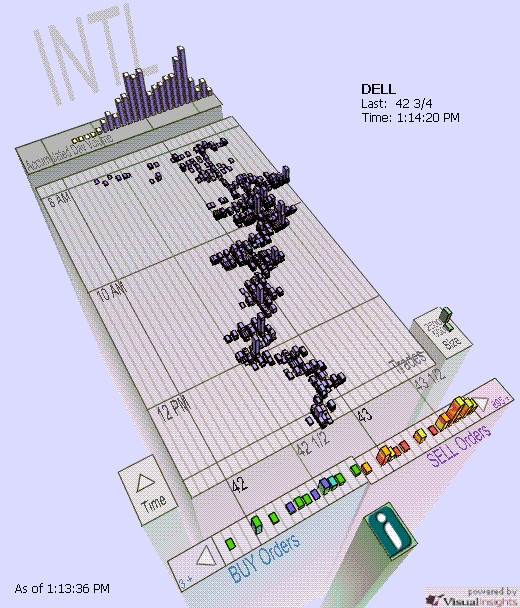
Here is an example of what a DepthChart looked like...
You'll have to trust me that it looked much cooler when it was animated with
live data. This snapshot is of a very early version- newer versions were much prettier.
I still think this is the absolute best way to display 2 dimensional quote data
and I am surprised that almost no one uses it today. If you develop market data
systems and are interested in using this display in your system, please let me
know and I'll make you an offer you can't refuse.
UPDATE 2012-07-11:
Not sure why, but there has been sum recent buzz on this very long dormant
project.